Your AI research lab
Test more ideas.
Build on what you learn.
Explore data, build interactive tools, and automate repeatable work.
Keep your inputs, methods, and results together so your next project builds on the last.
Start with your coding agent
Sensor calibration study
Which calibration approach holds up?
Compare error curves as sensor drift increases, then inspect the reading-by-drift heatmap. All three methods use the same held-out measurements.
3 approaches / 6 training readings / 5 held-out readings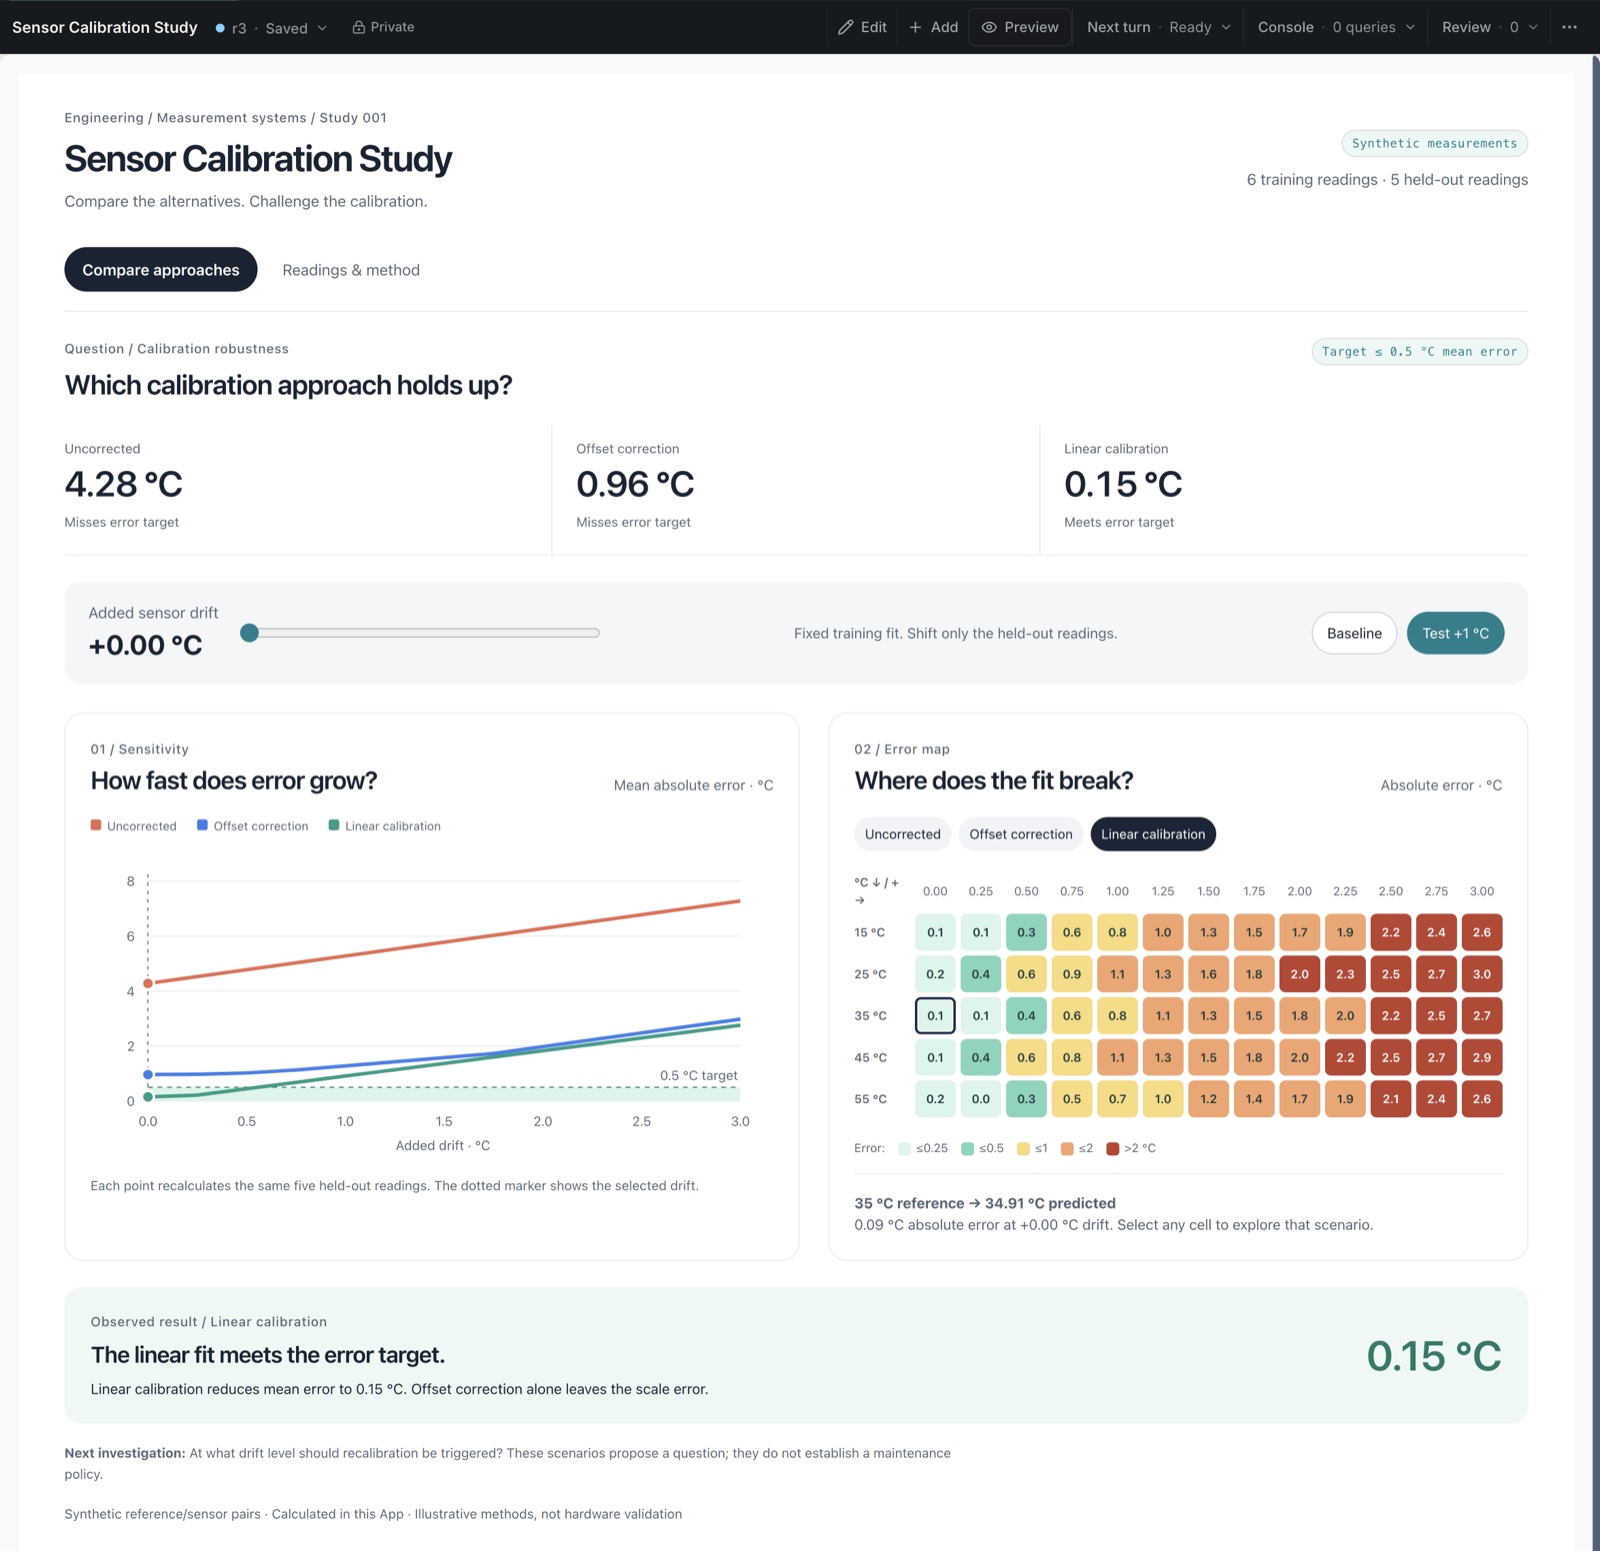
Swipe the capture to inspect it, or open it full size.
- Question
- Which calibration corrects both sensor bias and scale error, and how sensitive is it to drift?
- Method
- Fit on six synthetic training readings. Plot each method’s error across added drift and inspect five separate readings without refitting.
- Result
- Linear calibration meets the 0.5 °C mean-error target at baseline. Adding 1 °C of drift makes the original fit miss it.
A place to start
What are you working on?
Start with a question, a client engagement, or work your team repeats. Build from there.
01 / A developing investigation
One result opens the next question.
Research rarely ends with a single answer. Compare approaches, investigate surprises, and build on earlier work without starting over.
Back to the working Apps ↑- 01 / Ask
Can a simple calibration meet our accuracy target?
Which approach keeps average temperature error below 0.5 °C on unseen readings?
- 02 / Test
Compare three approaches.
Use the same training measurements. Compare uncorrected readings, offset correction, and linear calibration on held-out data.
- 03 / Learn
Correcting bias alone is not enough.
In the synthetic baseline, linear calibration meets the target. The offset-only approach still leaves a scale error.
- 04 / Investigate next
When should we recalibrate?
Open the drift stress-test capture above to see the original fit miss its target. Proposed follow-up: compare recalibration intervals using the same evaluation method.
02 / Project knowledge
Keep what you learn.
An answer is more useful when you can return to the question, assumptions, and evidence behind it.
Keep definitions in Context, calculations in Models, and interactive comparisons in Apps. Preserve the methods and records your team needs to revisit a result or take the work further.
See how the workspace fits togetherIllustrative workflow / Experiment Bench
A retry policy must deliver every packet and keep p95 delay below 10 minutes. Delivery alone is not a pass.
Compare both measures against the target using the same fixture. Keep the assumptions available for review.
Complete delivery misses the delay target. A proposed follow-up changes the retry interval while keeping the comparison method.
03 / Your AI lab partner
Work between questions and answers.
Work with the built-in agent or bring your own assistant. Develop an approach, inspect data, write calculations, and build tools around the question you’re investigating.
Explore the product ↗Develop an approach
Turn an initial question into a method you can inspect. Identify assumptions, relevant data, and a useful first calculation.
Put the method to work
Build Models, Apps, and Actions to analyze data, compare scenarios, and run repeatable work.
Examine the result
Compare what happened with what you expected. Investigate exceptions and keep limitations visible.
Take the next step
Bring earlier findings and methods into the conversation as you develop the next investigation.
04 / Getting started
Start with the evidence you have.
A dataset, a collection of documents, an existing analysis, or a question you haven’t yet resolved.
Bring files and connect supported data sources. Work with the agent to understand the records, define the measures, and prepare the analysis. When evidence is missing, make that part of the investigation.
05 / Reusable tools
Build tools you can return to.
Turn useful analysis into an interactive App. Change assumptions, compare alternatives, and inspect the calculations behind a result.
Keep repeatable calculations in Models and repeatable execution in Actions. Use them again when new data arrives or the question changes.
This browser example uses a synthetic sample. Change the measure or cost assumption and inspect the result. The Apps above show how a larger investigation takes shape.
Which price should we test next?
Three prices. 1,000 visitors each. A different answer depending on what you measure.
Change the cost. The recorded purchases stay the same.
At $40 cost per purchase, $100 has the highest observed contribution—even though $80 brings in more purchases.
Explore the tradeoff. These estimates do not establish a winning price.Inspect the data and method
Illustrative data for the same product, with visitors randomly assigned to one of three prices. No real customers or test. Each visitor can purchase once; no refunds or basket variation.
| Price | Visitors | Purchases | Per visitor |
|---|---|---|---|
| $80 | 1,000 | 150 | $6.00 |
| $100 | 1,000 | 132 | $7.92 |
| $120 | 1,000 | 90 | $7.20 |
Contribution per visitor = (price − cost per purchase) × purchases / visitors. Contribution is after the assumed variable cost per purchase and before acquisition and fixed costs.
Whiskers show approximate 95% Wilson intervals for each independent group, scaled by fixed price or margin for monetary measures. They are not a test between prices or a probability of winning. Cost uncertainty is not included.
Changing the measure is exploratory. Choose the primary measure and comparison before a fresh test; inspect uncertainty and business constraints before changing live prices.
Continue in a new chat with these sample inputs and your selected assumptions.
06 / Fields of investigation
Different fields. Questions worth investigating.
Use the method the question calls for: exploratory analysis, simulation, forecasting, or controlled experimentation. Keep clear what each result can establish.
Find your workflow ↗For universities & research groups
Start with one research question.
Work with our team on a scoped pilot: a permitted dataset, an inspectable method, and an App your group can use and extend.
07 / Under the interface
Inspect the work. Extend it.
Apps are React projects. Models are SQL. Actions are TypeScript. Work through the interface, collaborate with an agent, or inspect the underlying files.
Keep definitions and methods available to the people who need to understand and develop them.
Scoped access, revision history, and execution records help your team review the work.
The next question
What would you investigate next?
Start with a question. Develop a method. Build something useful—and carry what you learn into the next investigation.